Make decision: the method description
ƒ RD AAOW FDL; 12.01.2025; 20:44
Page contents
- General information
- How does it work
- Description of the method
- Conclusion
- Controls
- Download links
- Версия на русском языке
General information
The Make decision app illustrates a non-linear method for analyzing hierarchies. The method involves comparing some objects, phenomena or outcomes of events based on a set of criteria and the choice of the most “correct” of them, i.e. that one, which will have the highest score. The user is prompted to select elements and criteria for their comparison, as well as to evaluate the significance of each criterion and the “cost” of the element for each criterion. Based on this information, the program receives a result.
The first version of the app was created in the Microsoft Visual Basic 6.0 development environment. Even then it was not the best remedy. However, in this case, its capabilities were quite enough. Moreover, its simplicity allowed us to create a program in the shortest possible time. This implementation only transfers the solution to our common ecosystem.
During the development, only lecture material was used, the understanding of which is more than enough to create of this (and similar) illustrative applications.
More info you can find in this video guide.
How does it work
Let’s say we want to choose between purchasing a laptop, smartphone, tablet, and desktop. Let’s run Make decision and specify the devices to be compared. There should obviously be at least two points for comparison.

Note that if necessary, all steps can be repeated again at any time using the ↺ button, and the transition
to the next step (hereinafter) is performed with the ▶ button.
Next, we indicate the criteria by which we will compare devices. Let’s say it will be price, modernability (possibility of “overclocking”, replacement of components, etc.), power and convenience (the ability to take with you, use outside, etc.).
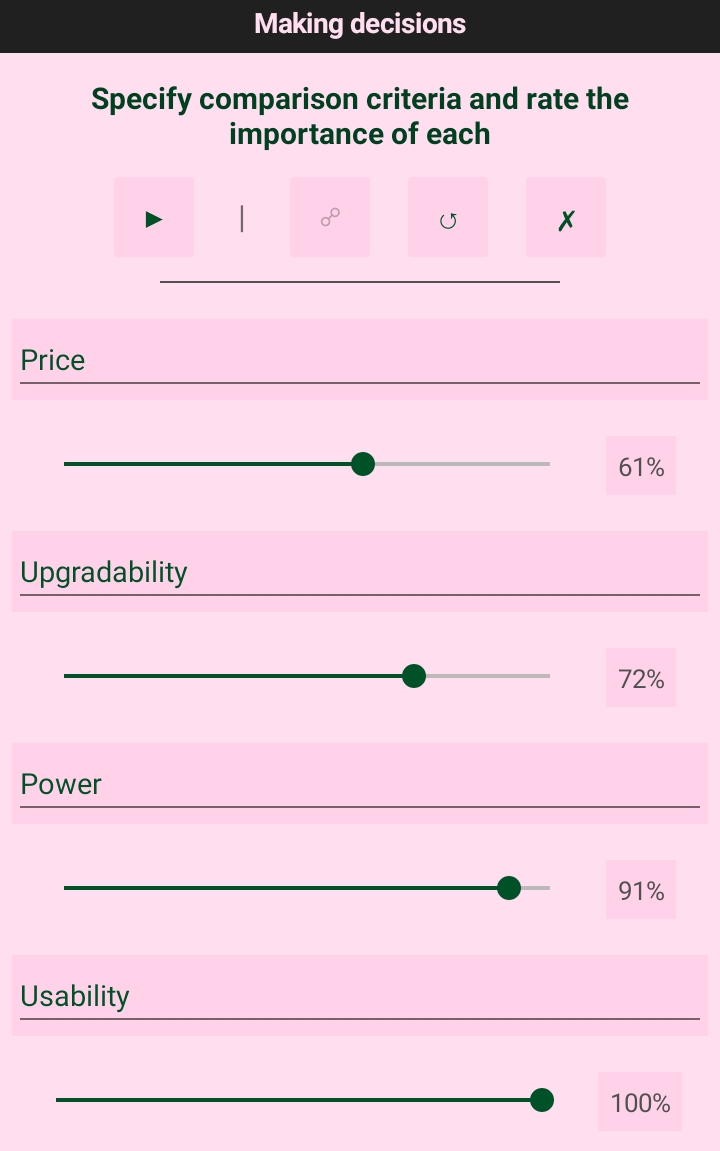
At the same time, it is important to indicate the “costs” of these criteria when making a decision. It means some abstract number, like a scale from 1 to 100, which would be larger for a more significant parameter.
Let’s say we value convenience and power more than the ability to change the initial configuration and price in the store. The picture above shows this using sliders.
On the following screens (according to the number of comparison criteria), the program will prompt you to specify ratings for devices for each criterion. Note that these are exactly estimates. Those, the product with a higher price in our case will be have a lower score, because high cost is a less successful solution (however, this is not always the case).
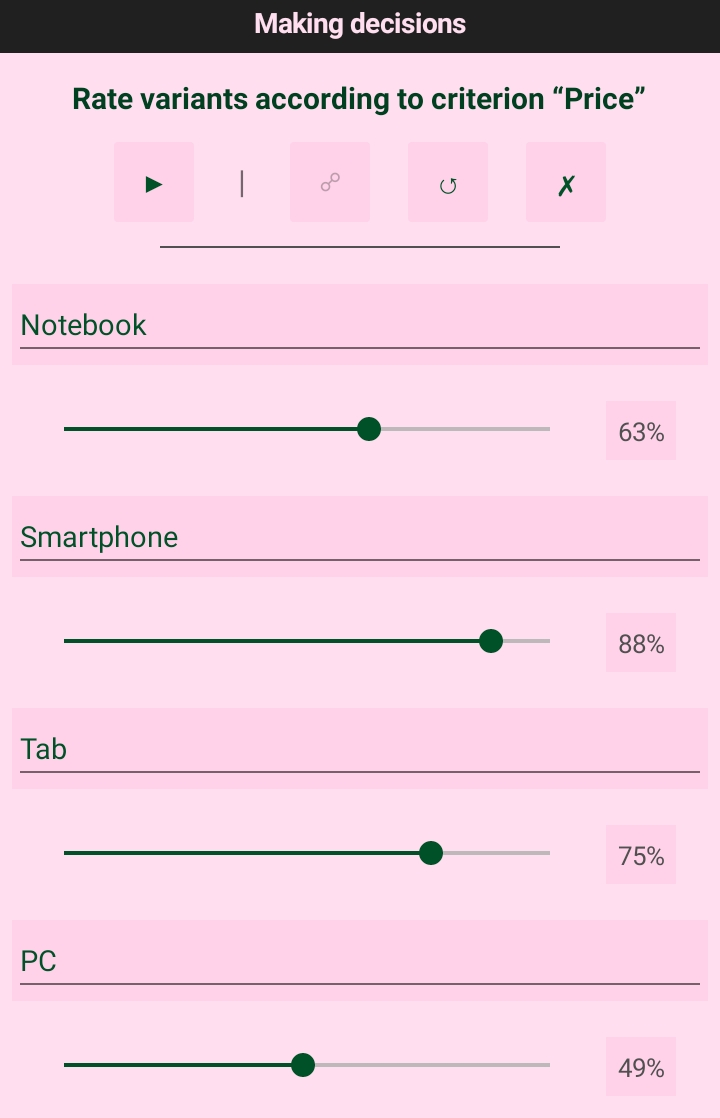
These are, of course, controversial points. But we entered such data based on our own experience. Ideally, these estimates should produce on the basis of literature analysis, descriptions, examinations, reviews and comments. However, for less critical solutions may be enough good advice.
On the last screen, we get a mathematically sound answer: we need a tablet PC.
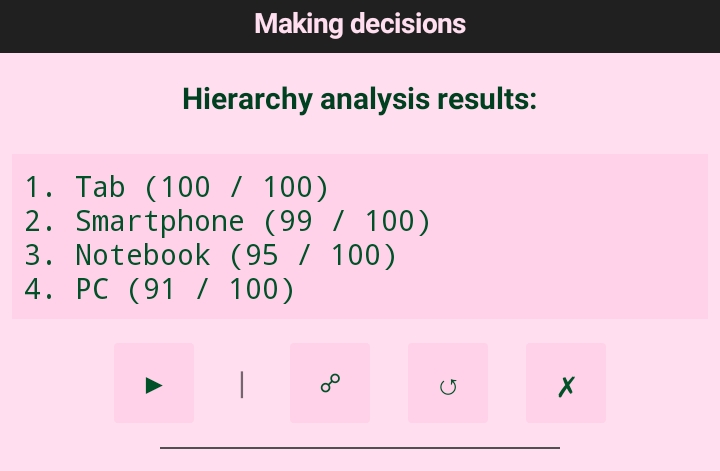
This, in general, meets our needs. Although, strictly speaking, the smartphone is not far behind in the total coefficient and can also be considered as a solution.
Note that the app supports up to 10 elements and up to 10 criteria, i.e. allows you to take much more complex and multifactorial decisions than in this example. And this is quite simple, because the mathematical apparatus solutions aren’t evident to the user.
At the end of the procedure, the program can be returned to its initial state using the ↺ and ▶ buttons. Object names
and criteria are saved until they are changed manually or reset with the ✗ button.
Description of the method
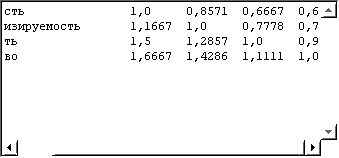
After the user fills lists of elements for comparison and criteria with their values, from the resulting vector ratings, a comparison matrix is created. To do this, duplication of the original vector is performed until the matrix doesn’t become square. After that, each column is divided into that element whose number is equal to the number columns in a matrix. As a result, in the matrix on the main diagonal, all elements become equal to one (this process is known as matrix normalization).
Similarly, the vectors of evaluations of elements for each criterion are set and processed.
The final scores of the elements are obtained as follows:
-
For all normalized matrices (both criteria and elements), vectors of mean harmonics are compiled: each element of the vector is equal to the product of the elements of the corresponding row of the matrix, raised to a power, reciprocal of the number of elements in the row.
-
Then the matrices are multiplied by these vectors.
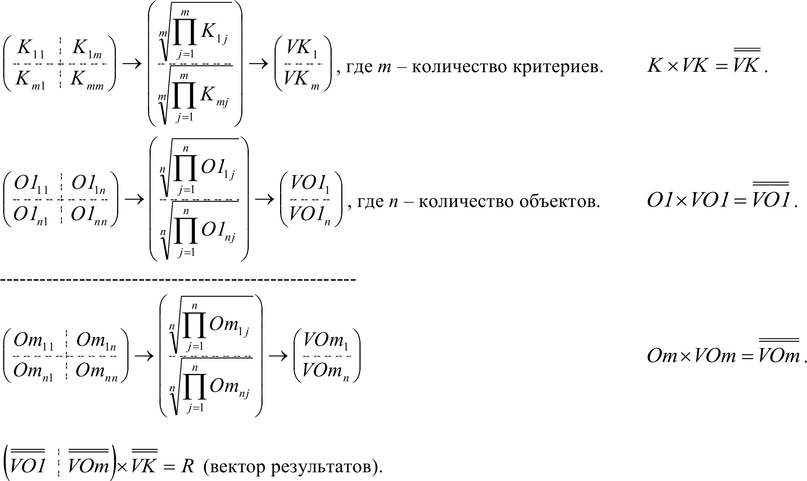
-
Next, the resulting cost vectors of elements according to different criteria are glued into a matrix in the order in which these criteria were declared.
-
Finally, this matrix is multiplied by the criterion cost vector.
The resulting vector will be the result of the method. The largest number in it will indicate the “best” element under given conditions.
Conclusion
So, the non-linear method of analyzing hierarchies, with the correct indication of the initial data, may turn out to be indispensable in a seemingly insoluble choice. We strongly recommend that you try out this tool, when the question of “either-or” will rise especially sharply. However, it can also be useful in professional activities, because it uses a proven mathematical apparatus, which means the reliability and scientific nature of the solutions obtained.
Controls
For Windows:
Enter– enter values to listsShift+Enter– going to the next stepHome– restarting the sequenceF1– opening the App about window